Docker MCP CLI Commands and CheatSheet
The MCP Catalog currently includes over 120+ verified, containerized tools, with hundreds more on the way. Docker’s MCP Catalog now features an improved experience, making it easier to search, discover, and identify the right MCP servers for your workflows - all using CLI Interface.


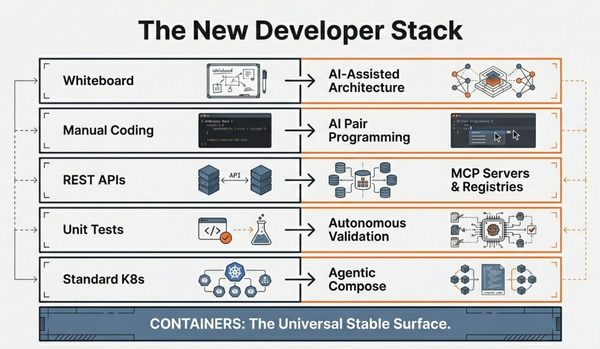
Docker has revolutionized the Agentic AI space with two complementary offerings that bring their legendary "build once, run anywhere" philosophy to AI agent tooling:
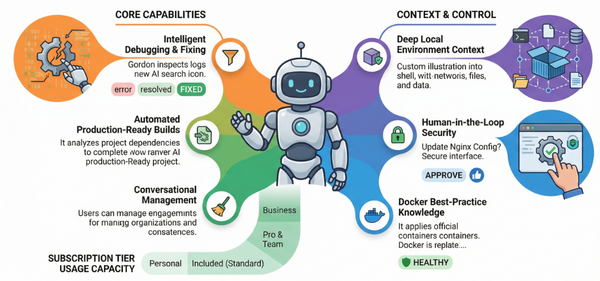
Docker MCP Toolkit - A comprehensive suite that makes MCP servers secure, seamless, and instantly usable. Features one-click launches from Docker Desktop, built-in OAuth credential management, universal client support (Claude Desktop, VS Code, Cursor, Continue.dev, Gordon), and enterprise-grade security through containerization.
Access the largest library of secure, containerized MCP servers
https://hub.docker.com/mcp
This represents a paradigm shift from complex, insecure tool integration to enterprise-ready AI capabilities that work consistently across development teams and production environments.
While Docker Desktop includes a built-in MCP Toolkit GUI that allows developers to easily add, remove, and manage MCP servers through a visual interface, this cheat sheet focuses on the CLI approach for developers who need:
- Script-based workflows for setting up MCP environments in automated pipelines
- Infrastructure as Code approaches to MCP server management
- Batch operations for enabling/disabling multiple servers programmatically
- DevOps integration with existing command-line toolchains
- Custom tooling development that wraps the Docker MCP CLI
- Integration with shell scripts and configuration management tools
- Programmatic credential management for dynamic environments
Grafana MCP Server + MCP Toolkit
Let's see how Docker MCP CLI can be used to connect to Grafana dashboard all using CLI (without Claude or any other client software)
Pre-requisite:
- Docker Desktop with MCP Toolkit Enabled
- Enable Grafana MCP Server
- A working instance of Grafana
docker run -d \
  --name grafana-local \
  -p 3002:3000 \
  -e "GF_SECURITY_ADMIN_USER=admin" \
  -e "GF_SECURITY_ADMIN_PASSWORD=admin" \
  -e "GF_USERS_ALLOW_SIGN_UP=false" \
  -e "GF_SECURITY_ALLOW_EMBEDDING=true" \
  grafana/grafana:latest
Please do note that we’re running Grafana on port 3002 instead of 3000 (as 3000 is quite common for your React or other web apps)
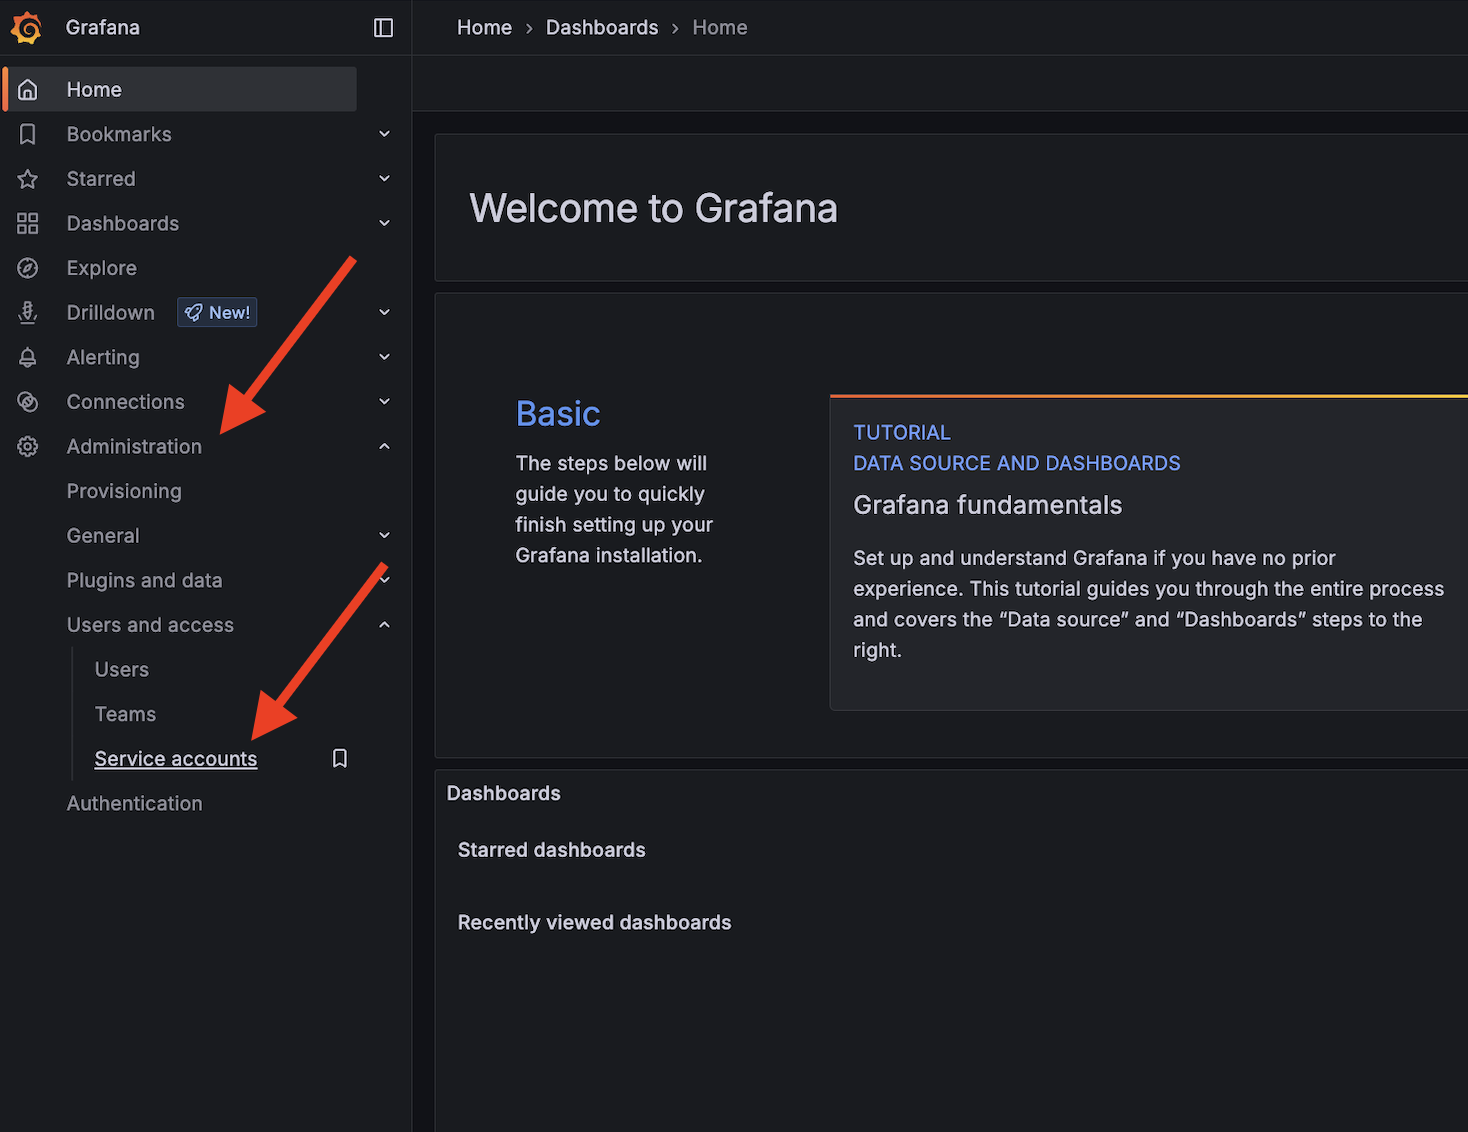
Create a new API Token under Service Account and save it somewhere. We will need it later.
Adding a Dashboard
To add a dashboard for our demo, open up Grafana and import this ready-to-use JSON https://gist.github.com/ajeetraina/a62dc67dd1c0478ec59ee9540af70bff
- Listing the MCP Server
docker mcp server listResult:
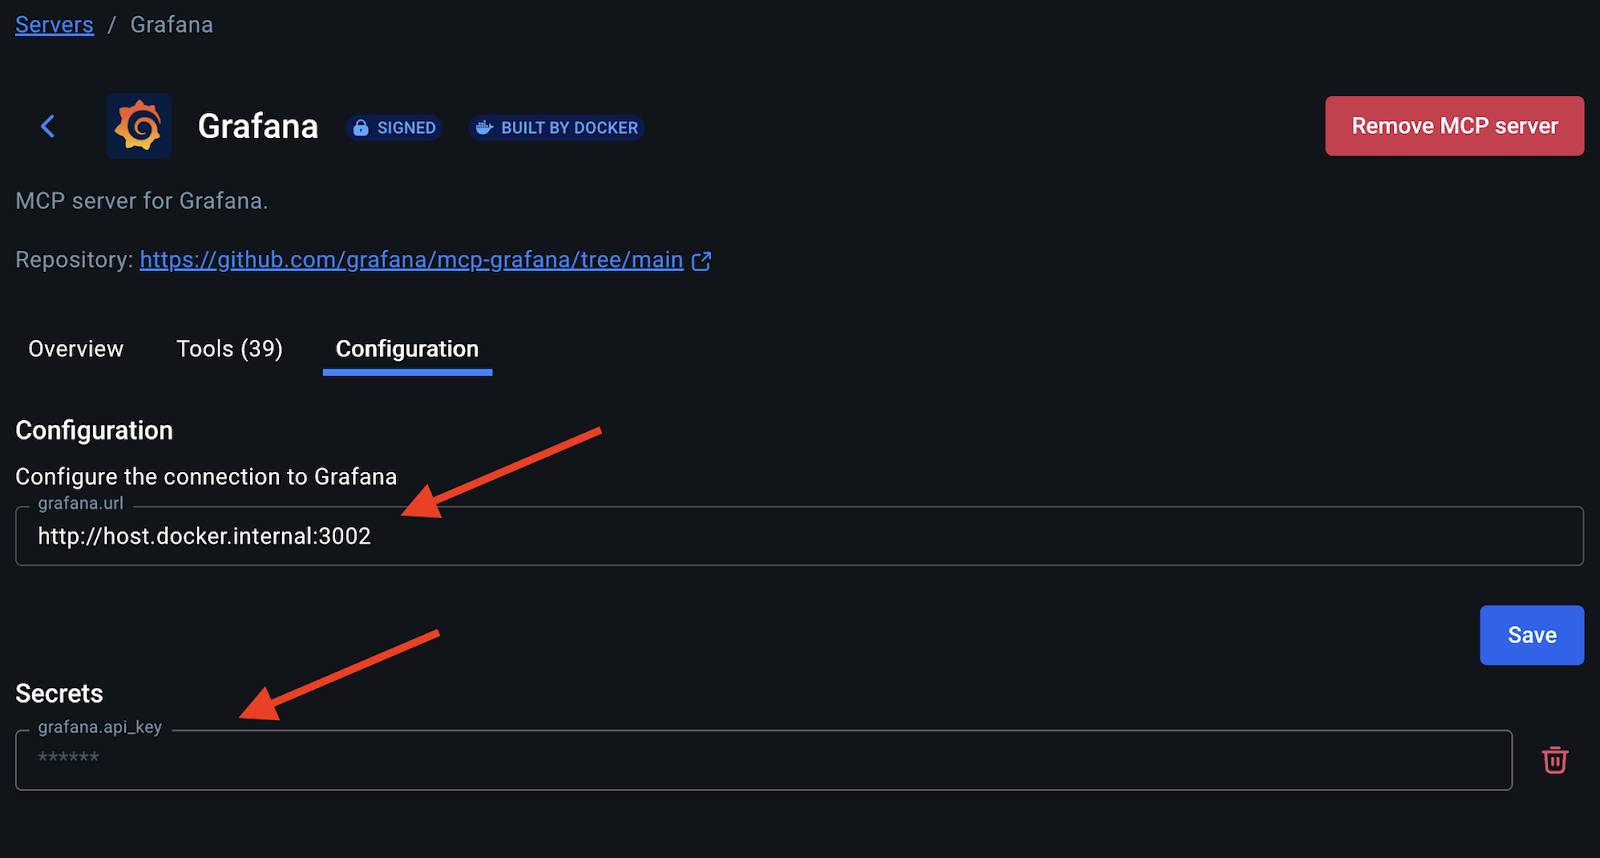
dockerhub, duckduckgo, firecrawl, github-official, grafana, sequentialthinking- Setting the Grafana URL
docker mcp secret set grafana.url=http://host.docker.internal:3002 - Setting the Grafana API Token
docker mcp secret set grafana.api_key=glsa_OhCXXXXXXX- Ensure that the configuration is reflected
cat ~/.docker/mcp/config.yaml- Ensure that the configuration is reflected
firecrawl:
  credit_critical_threshold: 0
  credit_warning_threshold: 0
  retry_backoff_factor: 0
  retry_delay: 0
  retry_max: 0
  retry_max_delay: 0
  url: fc-7e8c2e7fc67f41579ed1626e734ad48a
dockerhub:
  username: XXX
grafana:
url: http://host.docker.internal:3002- Run the MCP Gateway
docker mcp gateway run --verbose- Query the Grafana Dashboard using CLI
docker mcp tools call search_dashboards query="Enhanced Demo Dashboard"

Tool call took: 224.866583ms
[{"id":1,"permanentlyDeleteDate":"0001-01-01T00:00:00.000Z","tags":["demo","example","monitoring"],"title":"Enhanced Demo Dashboard","type":"dash-db","uid":"1ea12514-355a-4cfa-89ec-a102131d68b4","uri":"db/enhanced-demo-dashboard","url":"/d/1ea12514-355a-4cfa-89ec-a102131d68b4/enhanced-demo-dashboard"}]